
I ask contractors this question a lot: “How’s the company doing?”
Almost every time, I get a job-level answer. This job’s ahead of schedule. That job’s tight on labor. The one downtown is a headache, but it’ll work out.
That’s not a bad answer; it’s just the wrong question. Job cost reports tell you how a project is doing. They don’t tell you how your company is doing. And a business can be running three solid jobs and still be quietly losing ground, because nobody’s watching the numbers that show the whole picture.
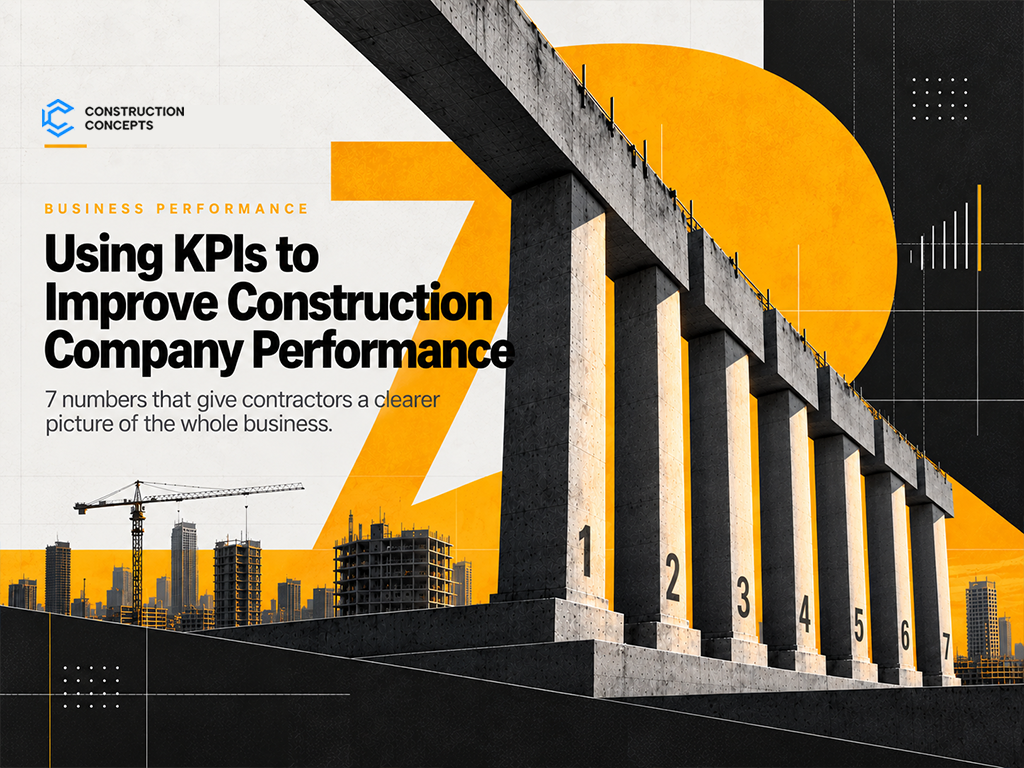
That’s what KPIs are for. Not a corporate dashboard for its own sake, a small, honest set of numbers that tell you the truth about your business before a bad quarter tells you for you.
Here are the ones worth tracking, and what to do once you’re watching them.
1. Gross Profit Margin by Job
Start here, because everything else builds on it. Track gross margin on every job, not just at closeout, but monthly, while the work is happening.
The number itself matters less than the trend. A job that starts at 18% margin and slides to 11% by the time it wraps isn’t a fluke. It’s telling you something: estimating was off, scope crept, or costs weren’t being tracked closely enough to catch it in time.
What to do: Review margin by job monthly, not just at completion. If a job is drifting, you want to know in month two, not at closeout.
2. Cost-to-Complete Accuracy
This is the gap between what you estimated a job would cost and what it’s actually costing, updated regularly as the job progresses, not guessed at from memory.
Contractors who are good at this catch problems early. Contractors who aren’t find out they’re over budget the same week they find out they’re behind schedule, which is the worst possible time to find out either.
What to do: Require project managers to update cost-to-complete on a fixed schedule, weekly or biweekly, not “when something feels off.”
3. Overhead as a Percentage of Revenue
Your overhead doesn’t feel like a problem until growth slows down and it’s still there. This ratio tells you how much of every dollar you bring in gets eaten before you ever get to the bottom line.
The number that matters isn’t the ratio in isolation. It’s whether it’s climbing while revenue is flat. That’s the pattern that quietly turns a profitable year into a break-even one.
What to do: Calculate this quarterly. If overhead is growing faster than revenue, that’s a conversation to have now, not after a slow season forces it.
4. Backlog-to-Revenue Ratio
Backlog tells you how much work you’ve got lined up relative to what you’re currently billing. Too little, and you’re one slow quarter away from a cash problem. Too much, and you risk over-committing your crews and your equipment.
This is one of the most useful numbers for planning, and one of the most commonly ignored, because it requires looking a few months ahead instead of just at what’s in front of you.
What to do: Review backlog monthly against your current run rate. If it’s thinning out, that’s your signal to get in front of business development — not after the pipeline’s already dry.
We can connect you with experts that can help you look at the right numbers.
5. Days Sales Outstanding (DSO)
This is how long it takes you to actually get paid after you bill for the work. It’s one of the clearest early warnings for a cash flow problem, because DSO usually starts creeping up months before the crunch actually hits.
A rising DSO doesn’t always mean clients are struggling. Sometimes it means your own billing and collections process has gotten loose. Either way, it’s worth knowing which one it is.
What to do: Track DSO monthly. If it’s trending up, look at your AR aging report and find out whether it’s a client issue or a process issue on your end.
6. Labor Productivity
Are your crews producing what you estimated they would, hour for hour? This is the number that connects your estimating to your reality. When it’s off, it usually shows up as margin erosion long before anyone can say exactly why.
What to do: Compare estimated labor hours to actual, by job and by crew, and look for patterns, not just one-off jobs, but recurring gaps that point to an estimating or supervision issue.
7. Experience Modification Rate (EMod)
Your EMod isn’t just a safety number, it’s a financial one. It directly affects what you pay for workers’ comp, and in many markets, it affects whether you’re even eligible to bid certain work.
Contractors who treat safety as a compliance box to check tend to have EMods that drift upward over time. Contractors who treat it as a business priority tend to see the opposite, and it shows up on their bottom line every year, not just in the absence of accidents.
What to do: Review your EMod trend annually with your broker, and treat any upward movement as a business issue, not just a safety one.
Building the Habit
None of these numbers are complicated to calculate. What’s hard is doing it consistently: pulling them on a set schedule, sitting with what they’re telling you, and asking why, every month, whether the news is good or not.
The contractors who stay ahead of trouble aren’t the ones with the fanciest reporting software. They’re the ones who look sooner, and who treat a shifting number as information instead of noise.
Pick a day each month, right after your books close is usually the natural spot, and run through these seven. Compare to last month. Compare to the same month last year. If something’s moved, ask why before it moves again.
Your numbers are already telling you the story of your company. The only question is whether you’re reading it in time to act on it.
If you’re not sure where to start pulling these numbers from your current reporting, that’s a conversation worth having sooner rather than later. Not after a tight quarter makes the decision for you.
We can connect you with experts that can help you look at the right numbers.